GeoGuessBench
Can AI models tell where in the world they are?
We gave 15 vision models 100 street-level photos from around the world and asked them to pinpoint the location. Here's how they did.
Leaderboard
Model rankings across all 73 locations, scored on the GeoGuessr scale (0-5000 points).
| # | Model | Avg Score ▼ | Avg Dist | Country | Confidence | ECE | Cost | Speed |
|---|---|---|---|---|---|---|---|---|
| 1 | Gemini 3 Pro Flagship | 4,771 | 134 km | 95% | 98 | 0.012 | $0.44 | 49s |
| 2 | Gemini 3 Flash Budget | 4,757 | 121 km | 94% | 94 | 0.043 | $0.07 | 10.9s |
| 3 | o3 Reasoning | 4,671 | 143 km | 93% | 69 | 0.315 | $0.29 | 10.4s |
| 4 | o4-mini Reasoning | 4,659 | 166 km | 85% | 75 | 0.253 | $0.17 | 5.1s |
| 5 | Gemini 2.5 Pro Flagship | 4,514 | 371 km | 90% | 100 | 0.075 | $0.18 | 16s |
| 6 | Gemini 2.5 Flash Budget | 4,497 | 446 km | 88% | 97 | 0.069 | $0.02 | 12.9s |
| 7 | Claude Opus 4.6 Flagship | 4,461 | 420 km | 84% | 69 | 0.354 | $3.66 | 7.7s |
| 8 | GPT-4o Mid-tier | 4,275 | 698 km | 81% | 87 | 0.220 | $0.84 | 5.4s |
| 9 | GPT-4.1 Flagship | 4,192 | 687 km | 78% | 90 | 0.184 | $0.68 | 5.8s |
| 10 | Grok 4 Flagship | 4,040 | 781 km | 74% | 86 | 0.222 | $1.21 | 145.1s |
| 11 | GPT-5.2 Flagship | 4,036 | 945 km | 72% | 62 | 0.396 | $0.54 | 3s |
| 12 | Grok 2 Vision Mid-tier | 3,861 | 952 km | 72% | 86 | 0.198 | $0.68 | 2s |
| 13 | GPT-4o Mini Budget | 3,843 | 989 km | 66% | 86 | 0.224 | $1.53 | 3.6s |
| 14 | Claude Sonnet 4.5 Mid-tier | 3,739 | 1,238 km | 67% | 80 | 0.272 | $0.80 | 11.7s |
| 15 | Claude Haiku 4.5 Budget | 3,304 | 1,675 km | 53% | 74 | 0.296 | $0.20 | 4.1s |
Example Predictions
Select a location to see where each model placed their pin. Hover over a prediction to read the model's reasoning.
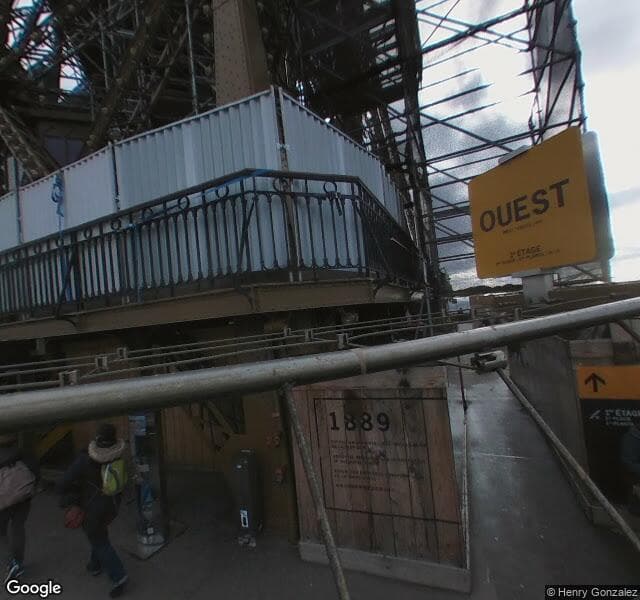
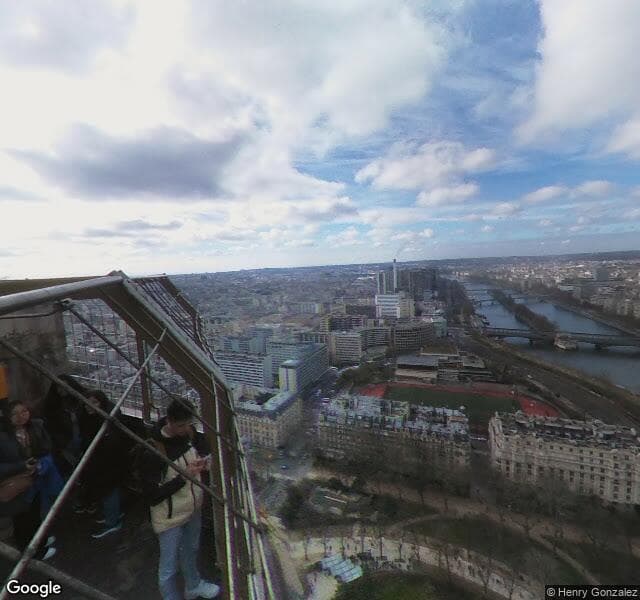
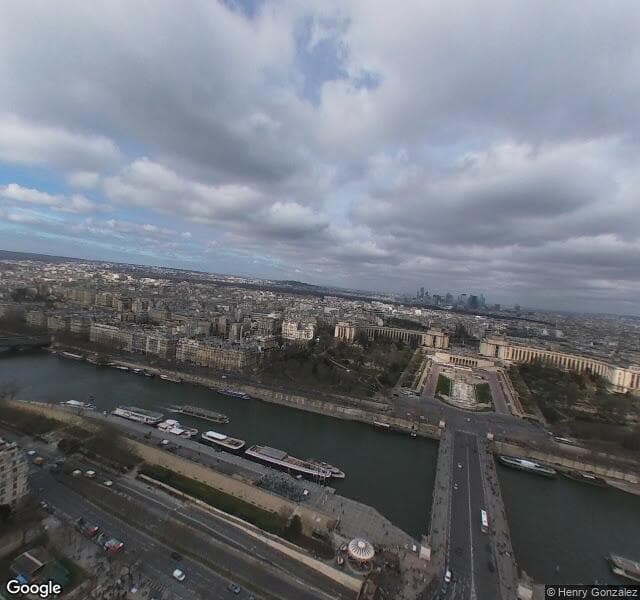
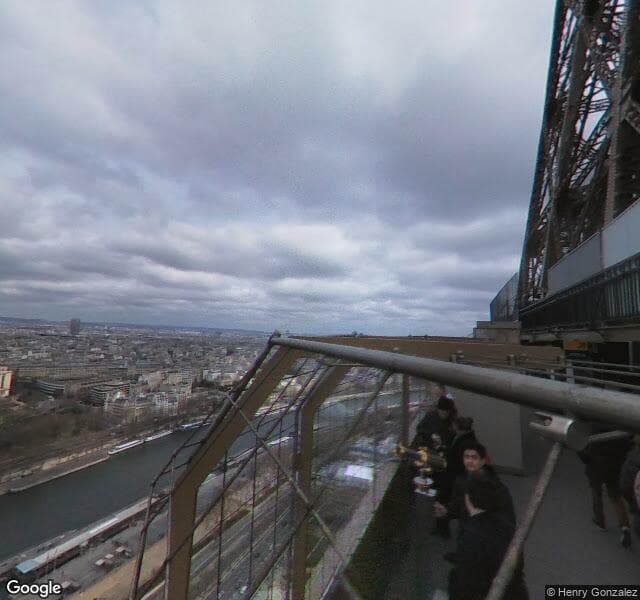
Near the Eiffel Tower, Paris
France · easy
48.8584, 2.2945
Can You Beat the AI?
Study the street-level imagery and place your pin on the map. See how your guess compares against each model.
How to Play
- Study the 4 street-level images above
- Click on the map to place your pin
- Click “Submit Guess” to see results
- Compare your score with the AI models!
Performance Over Time
How geolocation ability has improved as models evolve. Each point represents a model plotted by its release date.
Cost vs. Accuracy
Is paying 25x more for a flagship model worth it? We compare total cost against performance across all locations.
Total Cost vs. Average Score
Speed vs. Accuracy
Cost Efficiency: Score Per Dollar
Which model gives you the most geolocation bang for your buck?
Confidence Calibration
Do models know what they don't know? We analyze whether stated confidence matches actual performance.
“Models claimed 84% average confidence and were accurate 87% of the time.”
Overall, models are reasonably well-calibrated — their confidence roughly matches reality (84% claimed vs 87% actual). But individual models vary: some are overconfident, others underconfident. The ECE metric below quantifies this gap.
Confidence vs. Accuracy
Points above the diagonal are underconfident. Points below are overconfident.
Calibration Ranking (ECE)
Expected Calibration Error — lower is better. Measures how well confidence matches performance.
Calibration Curves (Top 4 Models)
Detailed reliability diagrams showing stated confidence (x) vs empirical accuracy (y) across confidence bins. The diagonal represents perfect calibration.
Difficulty and Scaling
How much does model size matter? We analyze performance across difficulty tiers and model families.
Score by Difficulty Tier
Model × Location Heatmap
Every model's score on every location. Hover for details. Columns sorted by difficulty (green = easy, amber = medium, red = hard).
Within-Family Scaling
Does moving from budget to flagship improve scores linearly?
Performance by Continent
Average score across all models by continent.
Methodology
How the benchmark works, what we measured, and the limitations to keep in mind.
Image Source
All images are pulled from the Google Street View Static API at 800×600 resolution. For each location, we capture 4 views at 90° intervals (North, East, South, West), giving models a full panoramic perspective identical to what a human player would see in GeoGuessr.
Location Curation
We curated locations spanning 6 continents with a deliberate difficulty distribution: ~15% easy (iconic landmarks, distinctive scripts), ~35% medium (readable signage, recognizable architecture), and ~50% hard (unmarked rural roads, ambiguous towns, Southern Hemisphere lookalikes). Hard locations are designed to challenge even expert human players.
Evaluation Protocol
Each model receives the same system prompt asking for a JSON response with latitude, longitude, confidence (0–100), country guess, and chain-of-thought reasoning. We use temperature 0 (deterministic) for reproducibility, following standard benchmark convention (MMLU, HumanEval, etc.). OpenAI o-series reasoning models require temperature 1 per their API constraints. For reference, GeoBench uses temperature 0.4. Each location is evaluated once per model; a more rigorous approach would average multiple trials at a small positive temperature, but this triples cost for marginal improvement.
Scoring
We use the GeoGuessr formula: 5000 × e^(-d/1492.7) where d is the distance in km. This gives 5000 for perfect, ~4500 for 150km, ~2500 for 750km, and ~500 for 2500km. We also compute Expected Calibration Error (ECE) to assess confidence calibration.
Models Tested
15 vision models from 4 providers: Anthropic (Claude Haiku 4.5, Sonnet 4.5, Opus 4.6), OpenAI (GPT-4o Mini, GPT-4o, GPT-4.1, GPT-5.2, o3, o4-mini), Google (Gemini 2.5 Flash, 2.5 Pro, 3 Flash, 3 Pro), and xAI (Grok 2 Vision, Grok 4). A key dimension is within-family scaling: budget vs. mid vs. flagship from each provider.
What Sets This Apart
Compared to related benchmarks like GeoBench, GeoGuessBench adds: (1) full panoramic mode with 4 cardinal views, (2) confidence calibration analysis with ECE scoring, (3) within-family scaling analysis across model tiers, (4) cost efficiency benchmarking, and (5) an interactive human baseline where visitors can test themselves.
Limitations
Google Street View coverage is biased toward developed countries and urban areas. Our 100-location sample is illustrative but not exhaustive. Model performance may vary across runs due to API non-determinism, particularly for reasoning models at temperature 1. Costs are approximate based on token counts. Reasoning models (o3, o4-mini) and thinking models (Gemini 3 Pro) had higher response parse failure rates — failed responses are excluded from scoring, which means their averages are computed over fewer locations. Some models may have seen Street View imagery in training data.
Built with Next.js, Tailwind CSS, and Recharts.
Evaluation pipeline in Python with support for Anthropic, OpenAI, Google, and xAI APIs.